<img height="1" width="1" style="display:none;" alt="" src="https://px.ads.linkedin.com/collect/?pid=1549393&amp;fmt=gif">

What’s new in data strategy and why it matters now

From the Data Desk

There is a version of the AI story that gets told in keynotes, and a version that shows up in the data. The keynote version says adoption is everywhere and accelerating. The data version, which we look at in this issue, says something more specific: adoption is broad, but it is shallow. Most businesses that use AI are using it in a narrow slice of their operations, and the ones going deeper share a common trait. They invested in their data foundations first. 

That gap between broad and deep is the thread running through this edition. We look at what the Census Bureau’s most current AI adoption data actually shows, including where mid-market companies sit in the picture. We cover an unusual moment in the platform market: the two largest data platforms held their flagship conferences within two weeks of each other and delivered what amounted to the same message. We look at what Microsoft shipped in Power BI this quarter and why the semantic model keeps showing up at the center of everything. And we cover a completed merger that consolidates two tools many mid-market data teams already rely on.

In the Actionable Insight section, we get practical about the idea underneath all of it: what it actually takes to define a metric your organization can trust, and how to certify the handful that matter most.

As always, the goal is clarity over coverage.

In the Data

AI adoption is broad, but it is shallow, and the difference matters

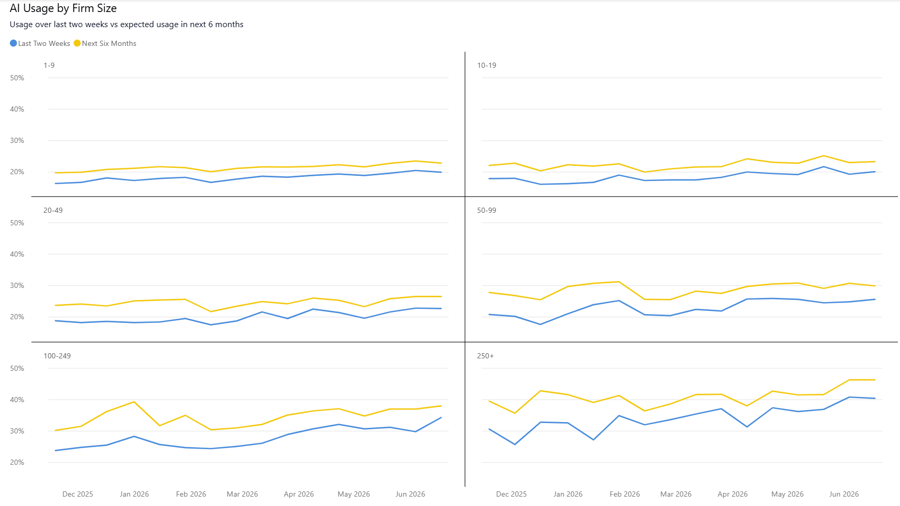
If you only read headlines, you might conclude that nearly every business is running on AI. The Census Bureau’s Business Trends and Outlook Survey, which asks a nationally representative sample of businesses every two weeks whether they used AI in a business function in the prior two weeks, tells a more grounded story. Between December 2025 and May 2026, overall AI use hovered between 17 and 20 percent of businesses, reaching 19.8 percent in the most recent reading. Between 20 and 23 percent expected to be using AI within six months.

The more interesting pattern is underneath the headline number. Adoption climbs steadily with company size: 37 percent of firms with 250 or more employees reported using AI, 32 percent of firms with 100 to 249 employees, and less than 20 percent of firms with fewer than five employees. The mid-market, in other words, is adopting at nearly the same rate as large enterprises, a fact that gets lost in coverage framing AI as either a Fortune 500 story or a small business story.

AI USage IMage


But the depth of adoption is where the data gets genuinely useful. A Census working paper analyzing the survey’s AI supplement found that among firms that have adopted AI, 57 percent use it in three or fewer business functions. The most common functions are sales and marketing and strategy and business development. So the typical AI-adopting business today is not an AI-driven business. It is a business where one or two teams have found a use case, while the rest of the operation runs the way it always has.

One caveat worth noting: the Census revised the survey’s AI questions in November 2025 to ask about use in any business function rather than only in producing goods or services, so comparisons to earlier years should be made carefully. The question now casts a wider net.

For business leaders, the planning implication is this. The competitive question is no longer whether your peers are using AI. Roughly one in five are, and in the mid-market it is closer to one in three. The question is whether anyone in your market is moving from shallow adoption to deep integration, because that transition, not the initial adoption, is where operating advantages get built. And as the rest of this issue shows, the organizations making that transition are the ones whose data foundations can support it.

Sources:
- U.S. Census Bureau, “Large Firms With at Least 20 Employees Biggest AI Users” (May 2026): https://www.census.gov/library/stories/2026/05/ai-use-businesses.html
- U.S. Census Bureau working paper, “The Microstructure of AI Diffusion” (CES-WP-26-25, April 2026): https://www.census.gov/library/working-papers/2026/adrm/CES-WP-26-25.html

In Data

The two biggest data platforms just said the same thing, two weeks apart

Snowflake held its annual Summit in San Francisco June 1 through 4, drawing more than 20,000 attendees. Databricks held its Data + AI Summit in the same city two weeks later, June 15 through 18, with roughly 30,000. These are fierce competitors, and their conferences are normally exercises in differentiation. This year, the striking thing was how similar the core message was.

Snowflake’s announcements spanned more than two dozen capabilities, but nearly all of them served one thesis: AI agents operating on enterprise data need governed context to be useful. The company introduced Horizon Context and Semantic Studio to manage business meaning, rebranded Snowflake Intelligence as CoWork to put governed data in front of business users who will never write SQL, and published a benchmark claiming that answers to structured business questions were dramatically more accurate when the model had full business context than when a general-purpose model worked from raw data alone.

Databricks made the same argument in nearly the same words. CEO Ali Ghodsi framed it plainly in his keynote: the limiting factor for enterprise AI is not model intelligence, it is business context. The company’s headline launches, including Genie One as a generally available agentic interface for business teams, Genie Ontology as a live context layer underneath it, and Unity Catalog Metrics for governed metric definitions, all point at the same problem.

When two dominant platforms independently center their biggest events of the year on identical reasoning, that is not marketing coincidence. It is the market converging on a diagnosis. We wrote last issue about the semantic layer becoming a strategic conversation. A month later, both major platforms bet their conference keynotes on it. For leaders, the takeaway is not to pick a vendor. It is to recognize that the definitions, ownership, and governance of your business metrics have become the prerequisite the entire industry now agrees on.

Sources:
- Snowflake Summit 2026 recap: https://www.flexera.com/blog/perspectives/snowflake-summit-2026/ 
- Databricks Data + AI Summit 2026 announcements: https://www.databricks.com/company/newsroom/press-releases/databricks-announces-2026-data-ai-summit-keynote-lineup-and


Power BI is being rebuilt around the semantic model

Microsoft’s June 2026 Power BI release is worth reading less as a feature list and more as a statement about where the platform is headed. Several of the month’s most significant additions share a common trait: they treat the semantic model, the governed layer where data, definitions, and business logic live, as the foundation everything else gets built on.

Fabric Apps, announced at Microsoft Build and now rolling out, let developers and AI coding agents build full operational applications, such as inventory trackers or pricing tools, directly on top of an existing semantic model, reusing its governance and business logic rather than recreating them. Copilot in web modeling, now in preview, can review a semantic model, flag issues like inconsistent naming or unclear relationships, and make changes from natural language instructions. New agent skills can take a request as broad as a request for an executive dashboard through requirements, design, build, and publish stages. And Power BI answers are now available inside Microsoft 365 Copilot Chat, grounded in the same governed models and permissions behind existing reports rather than a separate, ungoverned layer.

The pattern is consistent with what Snowflake and Databricks announced at their conferences, which makes it more meaningful, not less. Microsoft is betting that the fastest path from a business question to a trusted answer is not a better dashboard. It is removing the steps between the question and the governed data underneath it.

For organizations running Power BI, which includes most of the mid-market, there is a practical implication. Every one of these capabilities inherits the quality of the semantic model it sits on. A well-governed model now powers dashboards, chat answers, AI-built reports, and full applications. A messy model now propagates its problems into all of those places at once. The return on cleaning up your models has never been higher, and neither has the cost of not doing it.

Source: Power BI June 2026 Feature Summary: https://community.fabric.microsoft.com/t5/Power-BI-Updates-Blog/Power-BI-June-2026-Feature-Summary/ba-p/5193264


Two staples of the modern data stack are now one company

On June 1, Fivetran and dbt Labs completed their merger, first announced in October 2025. Fivetran built its business moving data from operational systems into cloud warehouses. dbt became the de facto standard for transforming and modeling that data once it lands. Together, the combined company says it supports more than 100,000 data teams. Fivetran co-founder George Fraser continues as CEO, with dbt Labs co-founder Tristan Handy serving as President, and the company is initially operating as Fivetran + dbt Labs.

The stated rationale is the same theme running through this entire issue. The companies are positioning the combination around AI agents as a new class of data consumer, one that requires fresh, governed, context-rich data and cannot ask a colleague to reconcile a discrepancy the way a human analyst can. Ingestion, transformation, semantic context, and governance, the argument goes, belong in one integrated layer.

For business leaders whose teams use either tool, and many mid-market data teams use both, there are two things to watch. The first is practical: pricing, packaging, and product roadmaps tend to shift after mergers, so this is a reasonable moment to review contracts and confirm that the capabilities you depend on remain on the combined roadmap. The second is structural. The modern data stack era was defined by best-of-breed point solutions stitched together by data teams. This merger, alongside the platform expansion happening at Snowflake, Databricks, and Microsoft, suggests the market is consolidating toward integrated foundations. That is not automatically good or bad for buyers, but it changes the evaluation question from which individual tool is best toward how well an integrated stack fits your environment and how much flexibility you keep if your needs change.

Source: Fivetran press release, June 1, 2026: https://www.fivetran.com/press/fivetran-dbt-labs-complete-merger-to-create-the-data-infrastructure-for-trusted-ai-agents

 

Actionable Insight

Defining trusted metrics: how to certify the numbers your business runs on

Most organizations do not have a data shortage. They have a trust shortage. It shows up in a familiar scene: two dashboards report different revenue figures, a meeting stalls while people debate which number is right, and someone eventually gets assigned to reconcile them. The reconciliation usually reveals that both numbers are technically correct. They just answer slightly different questions, use slightly different filters, or refresh on slightly different schedules. Nobody wrote any of that down, so nobody could see it.

This has always been an expensive problem, but it was a manageable one, because humans were in the loop. A skeptical analyst could investigate. A CFO could ask where a number came from. What changed, as this issue has covered from several angles, is that AI tools are now answering business questions directly from data, and an AI tool does not pause to ask whether the revenue definition it found is the one your leadership team means. Whatever ambiguity exists in your metric definitions passes straight through into the answers, at scale, with confidence.

The response is not a new platform. It is a discipline: deciding which metrics your organization officially trusts, and making the basis for that trust explicit.

What makes a metric trusted

A trusted metric is not simply a correct one. It is a metric where five things are written down and agreed on:

  1. The definition. The precise business logic, in plain language and in code. Does revenue include intercompany sales? Is churn measured on logos or dollars? Which timestamp determines the period a transaction lands in?

  2. The owner. One named person accountable for the definition. Not a team, not a committee. When the definition needs to change, this person decides.

  3. The source of record. The single system or model this metric is calculated from. If the same metric can be pulled from three places, the trusted version comes from one of them.

  4. The refresh expectation. How current the number is supposed to be, so nobody treats yesterday’s figure as this morning’s.

  5. The known caveats. What the metric does not capture. Every metric has edge cases, and the trustworthy move is documenting them rather than letting users discover them.

If any of the five is missing, the metric can still be useful, but it is not yet trusted, and it should not be feeding executive reporting or AI tools.

A tiering approach that makes this manageable

Trying to certify every metric at once is how these initiatives die. A more workable model uses three tiers.

Certified metrics have all five elements documented and an owner who has signed off. These are the numbers that appear in board reporting, executive dashboards, and anything an AI tool answers questions from. Most organizations need somewhere between ten and twenty five of these, not hundreds.

Working metrics are in regular use but have not been through certification. They are fine for team-level analysis, clearly labeled as uncertified.

Exploratory metrics are ad hoc calculations built for a specific investigation. They are valuable and should not be governed heavily, but they should never silently graduate into executive reporting without passing through certification.

The tiers do two things at once. They focus the certification effort where the stakes are highest, and they give everyone in the organization a fast way to read how much weight a given number can bear.

Diagnostic questions to test where you stand

A quick self-assessment, applied to any metric on your primary executive dashboard:

  • If two people were asked to recalculate this metric from scratch, would they independently arrive at the same number?
  • Can anyone name the person who owns the definition?
  • If an AI assistant were connected to your data tomorrow and asked for this metric, are you confident which definition it would find?
  • When this metric last changed definition, was that change communicated, or did people discover it when the numbers moved?

An honest no on any of these is not a failure. It is a scoping exercise. It tells you exactly what certification work looks like for that metric.

Where to start

Pick the five metrics your leadership team looks at most, and run each one through the five elements above. Write down what exists and what is missing. In most organizations this takes a few working sessions, and it almost always surfaces at least one definitional disagreement that people did not realize they had. Resolving that disagreement, on paper, with an owner assigned, is worth more than most tooling purchases. It is also, as the platform vendors have now unanimously concluded, the entry fee for getting reliable answers out of AI. The organizations that pay it deliberately will be the ones whose shallow adoption has somewhere to deepen into.


CLOSING

The through-line of this edition is the distance between adopting AI and being ready for it. The Census data shows most businesses have crossed the first line and stalled short of the second. The platform market, with rare unanimity, has diagnosed why: the constraint is not intelligence, it is context, and context is built from governed data and trusted definitions. That work is unglamorous. It does not demo well at a conference. But it is the difference between AI that answers confidently and AI that answers correctly, and it is available to any organization willing to start with five metrics and a few honest conversations.

If any of this edition’s topics connect to challenges your organization is working through, we are glad to continue the conversation.


data@work is published by SVA Consulting. Each issue is designed to help business leaders understand what is changing in the data and analytics landscape, why it matters, and what to do with it.

Ready to transform your business?

Let’s chat! Just fill out the short contact form and our team will reach out shortly.
CONTACT US