<img height="1" width="1" style="display:none;" alt="" src="https://px.ads.linkedin.com/collect/?pid=1549393&amp;fmt=gif">

What’s new in data strategy and why it matters now

From the Data Desk

It is easy to talk about data and AI as if they were weightless. Models live in the cloud, dashboards live in the browser, and the whole enterprise seems to run on abstractions. This issue is about the opposite idea: the infrastructure underneath the intelligence, and what happens when it becomes the story.

Some of that infrastructure is physical. The Energy Information Administration now projects back-to-back record years for U.S. electricity demand, and data centers are the reason. Some of it is market structure. In the span of about a week, AWS acquired the company behind DuckDB and NVIDIA agreed to buy Hugging Face for nearly $13 billion, continuing a consolidation wave we first covered when Fivetran and dbt merged. Some of it is the platform layer itself, where Microsoft’s August Power BI release keeps reinforcing the semantic model as the foundation everything else is built on. And some of it is fragility: Boston Scientific became the latest major company to disclose that a cybersecurity incident had turned into a global operational disruption, part of a pattern that is now too consistent to treat as isolated bad luck.

In the Actionable Insight section, we take on the piece of foundation work that every framework we have shared so far quietly depends on: ownership. We have written about layering KPIs, auditing your analytics portfolio, and certifying trusted metrics. Each of those asks for “a named owner.” This issue covers how to actually assign one, and why most ownership models fail.

As always, the goal is clarity over coverage.

In the Data

Data centers are rewriting the U.S. electricity outlook, and the planning assumptions that go with it

In our first issue, we looked at wind and solar reaching a record share of U.S. electricity generation. This month, the same dataset family tells the other half of the story: it is not just the supply mix that is changing, it is the size of demand itself.

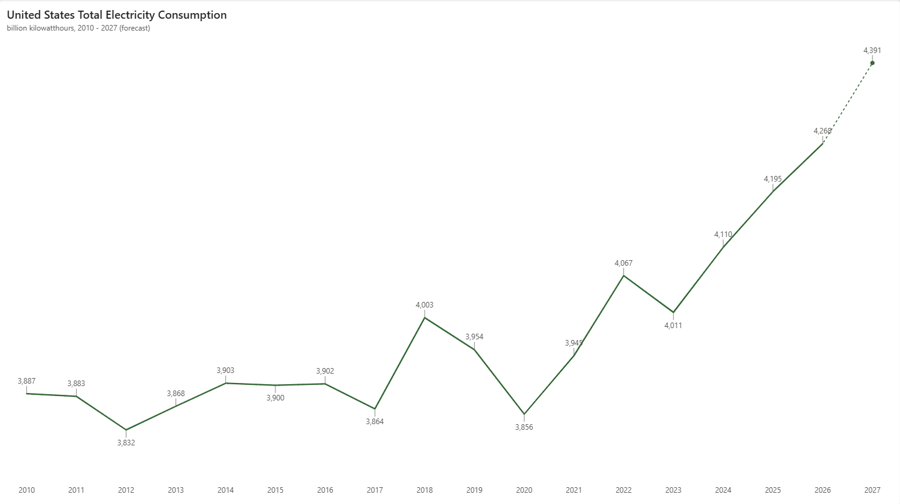
The EIA’s August Short-Term Energy Outlook projects U.S. electricity consumption will climb from the record 4,195 billion kilowatt-hours set in 2025 to 4,268 billion kWh in 2026 and 4,391 billion kWh in 2027 — back-to-back-to-back records. The commercial sector, which is where data center activity lives in the statistics, is the engine. Commercial electricity sales are projected to reach 1,545 billion kWh in 2026, surpassing the all-time high of 1,493 billion kWh set just last year.

image 1


The longer-term projections make the structural shift explicit. EIA estimates that data center servers alone accounted for roughly 7 percent of commercial-sector electricity consumption in 2025. In its Annual Energy Outlook projections, that share grows to between 22 and 33 percent of commercial building electricity use by 2050, with server consumption reaching between 446 and 818 billion kWh depending on the scenario. Commercial electricity intensity — kilowatt-hours consumed per square foot — is projected to exceed its 2003 historical high for the first time in 2031–2032, driven by servers and the cooling required to support them.

One recent development shows how quickly this can move in the other direction, too. After Texas announced a pause on new data center development on August 3, EIA cut its 2027 electricity load growth forecast for the state from 14 percent to 6 percent in a single revision. Policy decisions about data centers are now large enough to visibly move state-level demand forecasts.

For business leaders, the takeaway is that AI strategy now has a physical dimension. Compute is not an abstract line item; it is electricity, land, water, and grid capacity, and those constraints are starting to show up in cloud pricing, regional availability, facility location decisions, and sustainability reporting. Organizations building multi-year plans that assume cheap, unconstrained compute are making an assumption the underlying data no longer supports. This is the same lesson as the renewables story from Volume 01, one level deeper: the energy system and the information economy are converging into a single planning conversation.

Sources:

In Data

The consolidation of the data stack just accelerated — twice in one week

When we covered the completed Fivetran and dbt Labs merger in July, we suggested the modern data stack era of independent point solutions was giving way to integrated foundations. The past two weeks turned that suggestion into a trend line.

On August 26, AWS announced it was acquiring DuckLabs, the Amsterdam-based company behind DuckDB, the enormously popular in-process analytical database that many data teams use for local analysis, pipeline work, and lightweight transformation. The deal closed within days, and the entire DuckLabs team, including co-founders Hannes Mühleisen and Mark Raasveldt, joined AWS on September 1. Notably, the transaction does not include the DuckDB open-source project itself, which remains under the nonprofit DuckDB Foundation, stays MIT-licensed, and is adding a technical advisory board to give community members input on the project’s direction.

Then on September 2, NVIDIA entered a definitive agreement to acquire Hugging Face — the de facto home of open-source AI, with more than 18 million developers, over 3 million shared models, and more than 200,000 companies using the platform — for approximately $12.9 billion. The deal is expected to close in the first half of 2027, pending regulatory approval, and NVIDIA has stated Hugging Face will continue to support open-source and open-weight models.

Both acquirers went out of their way to promise continuity, and there is no reason to assume bad faith. But the structural fact remains: two of the most important pieces of open, vendor-neutral data and AI infrastructure are now owned by, or soon will be owned by, the largest cloud provider and the dominant AI chipmaker. For organizations that build on these tools, the practical checklist is the same one we offered after the Fivetran-dbt merger. Confirm the capabilities you depend on remain on the roadmap. Watch pricing and packaging over the next several quarters. And understand where the governance of the open-source project actually lives — in DuckDB’s case, the foundation structure is a meaningful protection; in others, it may not exist at all. The broader question for buyers is shifting from “which tool is best” to “how much independence does this tool retain, and how much do we need it to.”

Sources:


Power BI’s August release keeps building on the semantic model

Microsoft’s August 2026 Power BI update reads, at first glance, like routine housekeeping: an overhauled Theme pane with more control over colors, fonts, and visual defaults; chart formatting refinements; and mobile and embedded improvements. But three items continue the pattern we identified in July, when we wrote that Power BI is being rebuilt around the semantic model.

First, semantic model refresh in the Power BI Service is now more flexible, with separate options to refresh schema, data, or both — a small change that matters for teams managing large governed models, because it reduces the cost of keeping model structure and model contents in sync. Second, Direct Lake on OneLake now supports composite models, so teams can mix Direct Lake tables with Import and DirectQuery sources in one model rather than maintaining parallel versions. Third, and most significant for adoption: in early September, Fabric Apps built from the data app template will require only Read permission on the underlying semantic model, rather than Build permission. That sounds like a permissions footnote. In practice, it removes one of the main barriers to distributing data applications broadly, because consumers no longer need elevated model access just to use an app.

The through-line is the same one we have been tracking all year. Every new capability — apps, Copilot answers, AI-built reports — inherits the quality of the semantic model underneath it. Microsoft keeps lowering the friction between a governed model and the people who consume it, which raises the return on having well-governed models and raises the cost of not having them. If your organization runs on Power BI, the most valuable work available is still not building more reports. It is cleaning up the models the reports sit on.

Source:


Boston Scientific joins a pattern that is no longer possible to call isolated

On August 25, Boston Scientific identified a cybersecurity incident affecting some of its information technology systems, resulting in what the company described in its SEC filing as “a global disruption to the Company’s operations.” The disruption affected core business applications, including the ability to process and ship customer orders. As of the filing, the company had not determined a timeline for full restoration, and had not yet determined whether the incident is reasonably likely to have a material financial impact.

If this sounds familiar, it should. In our first issue, we covered a nearly identical disclosure from Stryker: a cyber incident that became, within days, an operational crisis affecting orders, manufacturing, and shipping. What has changed since May is that the pattern is now quantifiable. Between March 1 and August 18 of this year, 31 public companies filed 8-K disclosures for cybersecurity incidents, including Stryker, Coca-Cola, Medtronic, Amgen, Hasbro, and Levi Strauss. Boston Scientific makes the list longer, not different.

We include these stories in a data and analytics newsletter for a specific reason. When enterprise systems go down, the visible damage is operational — orders stop shipping. The less visible damage is informational: leadership loses the reporting, forecasting, and monitoring signals it relies on precisely when decisions are hardest. Companies that have invested in understanding their data flows — which systems feed which reports, which metrics have a single source of record, which processes can run on a degraded environment — recover their decision-making capability faster, even when system restoration takes weeks.

The planning question this raises is not “are we secure,” which belongs to the security function. It is “what does our data environment look like on day three of an outage” — which numbers leadership would still trust, which reporting would be reconstructible, and which decisions would have to be made blind. At a rate of more than one major disclosed incident per week among public companies, that is no longer a hypothetical exercise. It is a scenario with a base rate.

Sources:

Actionable Insight

Data ownership that actually works: how to assign the accountability everything else depends on

Over the past three issues, we have shared frameworks for layering KPIs, auditing your analytics portfolio, and certifying trusted metrics. Readers who tried any of them ran into the same requirement: each one asks for a named owner. A metric needs an owner. A dashboard needs an owner. A definition change needs someone with the authority to approve it. And in most organizations, that is exactly where the exercise stalls — because nobody knows how to assign ownership in a way that holds.

The usual failure modes are predictable. Ownership gets assigned to the data team, because they built the thing — but the data team cannot own the definition of revenue, because they do not own the business process that produces it. Ownership gets assigned to a committee, which means it is owned by no one; committees can advise on definitions, but a definitional dispute needs a person who can decide. Or ownership gets assigned in name only: a list is created, an org chart is annotated, and nothing about anyone’s actual responsibilities changes. Six months later the list is stale and the disputes are being resolved the old way, which is to say loudly and repeatedly.

What works better is a model with two distinct roles, clearly separated.

The business owner is accountable for what the data means. This person owns the definition, approves changes to it, resolves disputes about it, and answers for its fitness in decision-making. The business owner of a churn metric should be the leader accountable for retention — not because they can write the SQL, but because they are the person whose decisions the metric exists to support, and the person with the standing to say “this is what churn means here.”

The technical steward is accountable for how the data behaves. This person owns the pipeline, the refresh schedule, the quality monitoring, and the implementation of the definition in code. The steward usually sits on the data team, and their job is to make the system match what the business owner decided — and to flag when it quietly stops matching.

The separation matters because collapsing the two roles into one person is what makes ownership fail. Give both roles to the data team and definitions get made by people without the authority to enforce them. Give both to the business and the technical reality drifts away from the documented intent with no one watching. The pairing creates a working relationship with a clear contract: one decides, one implements, and each knows who to call.

Choosing the right business owner is more art than org chart, but two tests cut through most ambiguity. First, whose decisions does this data support? The owner should feel the consequences when the number is wrong. Second, who is closest to the process that generates the data? An owner who understands where the data comes from can evaluate proposed definition changes on substance rather than deferring to whoever argues longest. When those two tests point to different people, prefer the first — accountability for the decision outranks proximity to the mechanics.

What does an owner actually do? Four things, and it is worth writing them down as an explicit agreement rather than an implied one. They approve the definition and any change to it. They are the escalation point when two numbers disagree. They decide who can access the data and at what level, within organizational policy. And they review, on a regular cadence, whether the data still serves the decisions it was created to support. That last one is the connective tissue back to the analytics retrospective we described in Volume 02: owned data gets reviewed; unowned data just accumulates.

Two practical cautions from organizations that have done this well. Keep the number of owned assets small at first — ownership of everything is ownership of nothing. If you completed the certification exercise from last issue, you already have the right starting list: the five metrics your leadership team looks at most. Each needs exactly one business owner and one technical steward, named, informed, and agreed. And make ownership visible where the data lives: in the dashboard, in the data catalog, in the semantic model description. An owner nobody can find is an owner nobody consults.

A reasonable place to start this month: take your five most important metrics, and for each one write down two names — who owns what it means, and who owns how it behaves. If you cannot fill in both names for a metric your executive team relies on, that gap is the finding. Filling it will do more for the trustworthiness of your reporting than any tool you could buy, and it is the piece of groundwork that every other discipline in this series — certification, retrospectives, KPI design — quietly assumes is already in place.


CLOSING

The thread running through this edition is that foundations are becoming the story. Electricity demand is reshaping the economics of the AI era. Ownership of the tools underneath the data stack is consolidating into fewer hands. The semantic model keeps absorbing more of the weight of the analytics environment. And a steady drumbeat of operational disruptions is demonstrating what happens when digital foundations fail. None of this is glamorous, and little of it demos well at a conference. But the organizations that treat foundations — physical, contractual, semantic, and human — as strategic assets rather than plumbing are the ones that will still be standing on solid ground when the next wave of capability arrives.

If any of this edition’s topics connect to challenges your organization is working through, we are glad to continue the conversation.


data@work is published by SVA Consulting. Each issue is designed to help business leaders understand what is changing in the data and analytics landscape, why it matters, and what to do with it.

Ready to transform your business?

Let’s chat! Just fill out the short contact form and our team will reach out shortly.
CONTACT US